Show the Last 6 Months of Cost For Your AWS Cloud Broken Down by Service and Output a Tabular View

Introduction
Recently, I came across an intriguing output from a tool that displayed the last six months of AWS costs broken down by service in a neatly organized table. This sparked my interest in replicating this output using shell scripting, specifically employing the power of awk for data processing. The goal was to create a script that not only queries AWS for cost data but also formats it into a user-friendly table, comparable to what you might find in the AWS Cost Explorer console.
The AWS Query
The journey begins with the AWS Cost Explorer API. Using the AWS CLI, I crafted a query to fetch the last six months of amortized costs, grouped by service. The command used was:
aws ce get-cost-and-usage --time-period Start=$(date -d "-6 months" +%Y-%m-01),End=$(date +%Y-%m-%d) --granularity MONTHLY --metrics "AmortizedCost" --group-by Type=DIMENSION,Key=SERVICEThis command dynamically calculates the start and end dates based on the current date, ensuring that the report always reflects the most recent six-month period. The choice of AmortizedCost as the metric offers a comprehensive view of the costs, distributing reserved instance costs over the reservation period.
Parsing and Processing with awk
Having retrieved the raw data, the next step was to process and format it into a readable table. This is where awk, a powerful text-processing tool comes into play. The script is divided into three main blocks:
- BEGIN Block: This block initializes variables and splits the dates for column headers.
- Main Block: Here, each line of input is processed. It formats the dates, calculates costs, and tracks the maximum length of the resource names for table formatting.
- END Block: This final block generates the table output. It arranges the costs by resource and date, ensuring a clear and organized presentation of data.
The Script in Action
Here’s the script that accomplishes our task:
#!/usr/bin/env bash

json_output=$(aws ce get-cost-and-usage --time-period Start=$(date -d "-6 months" +%Y-%m-01),End=$(date +%Y-%m-%d) --granularity MONTHLY --metrics "AmortizedCost" --group-by Type=DIMENSION,Key=SERVICE | jq -r '.ResultsByTime[] | .TimePeriod.Start as $date | .Groups[] | [$date, .Keys[], (.Metrics.AmortizedCost.Amount // 0 | tostring)] | @tsv' | sed 's/"//g')

dates=$(echo "$json_output" | cut -f1 | uniq | sort -t'-' -k1,1 -k2,2 | awk -F'-' '{printf "%02d/%s\n", $2, substr($1,3,2)}')

echo "$json_output" | awk -v dates="$dates" -F'\t' '
BEGIN {
    split(dates, date_arr, "\n")
    for (i in date_arr) {
        ordered_dates[i] = date_arr[i]
    }
    max_resource_len = 0
}

{
    date = substr($1, 6, 2) "/" substr($1, 3, 2)
    resource = $2
    cost = ($3 == "" ? "0" : $3)
    costs[resource, date] = sprintf("%.2f", cost + 0.0)
    resources[resource]
    if (length(resource) > max_resource_len) {
        max_resource_len = length(resource)
    }
}

END {
    value_col_width=10
    # Determine column width for resources
    resource_col_width = max_resource_len + 2

    # Header: Resource names
    printf "%-" resource_col_width "s", "Resource"
    for (i = 1; i <= length(ordered_dates); i++) {
        printf "%-" value_col_width "s", ordered_dates[i]
    }
    print ""

    # Data: Costs by resource and date
    for (resource in resources) {
        printf "%-" resource_col_width "s", resource
        for (i = 1; i <= length(ordered_dates); i++) {
            printf "%-" value_col_width "s", (costs[resource, ordered_dates[i]] == "" ? "0.00" : costs[resource, ordered_dates[i]])
        }
        print ""
    }
}'
Output
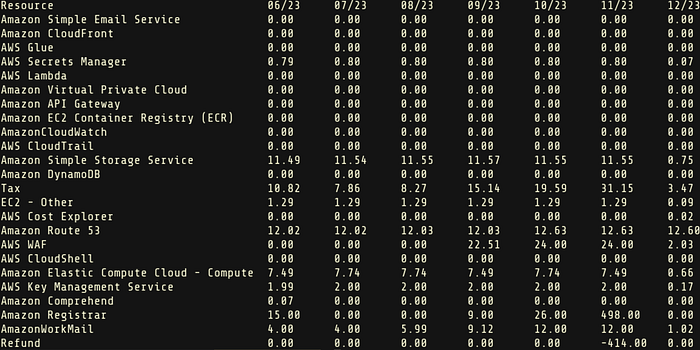
Comparing with AWS Cost Explorer
The output of this script closely mirrors the tabular view you would find in the AWS Cost Explorer console, making it an excellent tool for quick, command-line-based cost analysis. The advantage here is the automation and the ability to integrate this script into larger shell-based workflows or reports.
Use Cases
This script is particularly useful for:
- Automated monthly cost reporting.
- Quick, on-the-fly cost analysis without needing to log into the AWS console.
- Integration into larger cloud cost management and monitoring solutions.
Conclusion
The ability to fetch and neatly present AWS cost data directly from the command line is a powerful addition to any cloud engineer’s toolkit. While tools like AWS Cost Explorer provide a comprehensive GUI for cost analysis, having a script like this can save time and add flexibility to routine cost management tasks. It demonstrates the versatility of shell scripting and the power of combining different tools like AWS CLI and awk to achieve practical, real-world solutions.